When you’ve spent enough time trading inside a bank and watching markets for hours a day, in my case I traded my first stock when I was 11, sometimes you’re able to spot if something suddenly starts behaving weirdly.
This is exactly what happened with Morgan Stanley ($MS) in the last trading session. No news whatsoever hit the tape overnight or before US #stocks open about the bank, but yet the trading day started with such a “bang!💥”. A few minutes after trading began someone, somehow, had the urge to dump 4.3M $MS shares sending $MS stock straight to 85$. To give you an idea, $MS DAILY average volume in the past 3 months, before the last session, was about 8.3M shares. How many $MS shares have been traded in total during the last session? 23.2M of them with $MS stock ending the day down 3.88% (and it would have been almost 5% if a rescue bid didn’t come through at the end of the day). Needless to say, this is such a loud warning that something is wrong here 🚨
Time to figure out what’s going on 🍿
🚩 A very strange sentence buried in the latest $MS 10-K immediately catches my eye: “We may be responsible for representations and warranties associated with commercial and residential real estate loans and may incur losses in excess of our reserves”.
Now, as you know I read quite a bit of banks’ documents constantly and because of that, I can tell you such an explicit disclaimer is very rare to find.
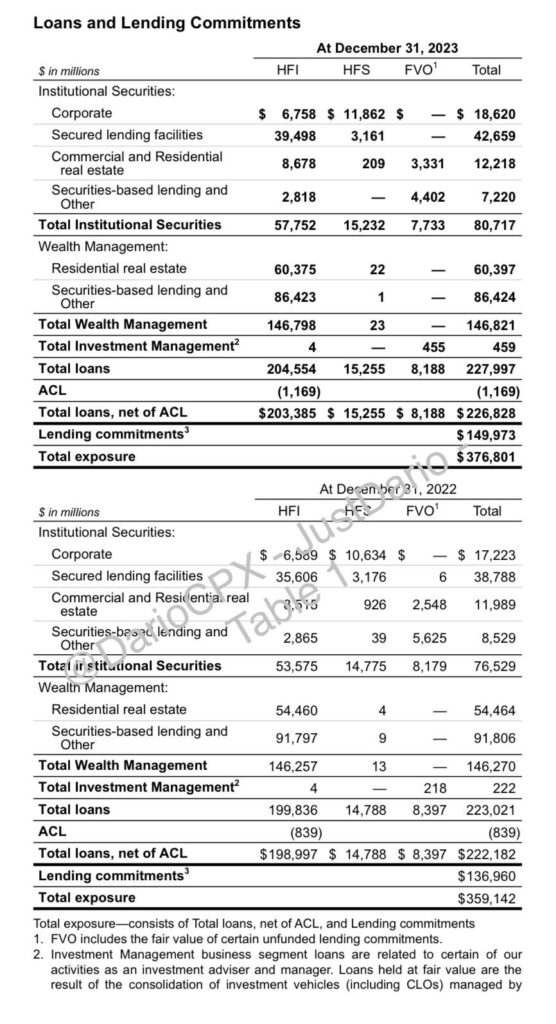
What’s even more unusual is that the amount of #RealEstate loans sitting in $MS books isn’t even that large with a total of 72bn$ of nominal value.

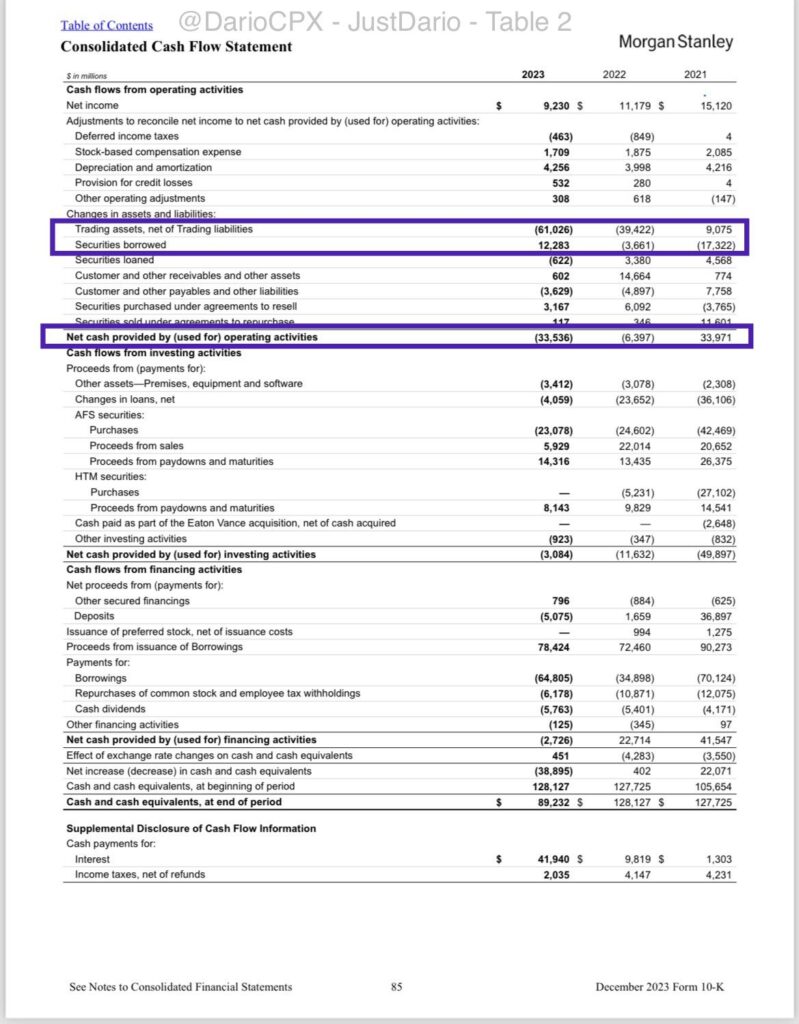
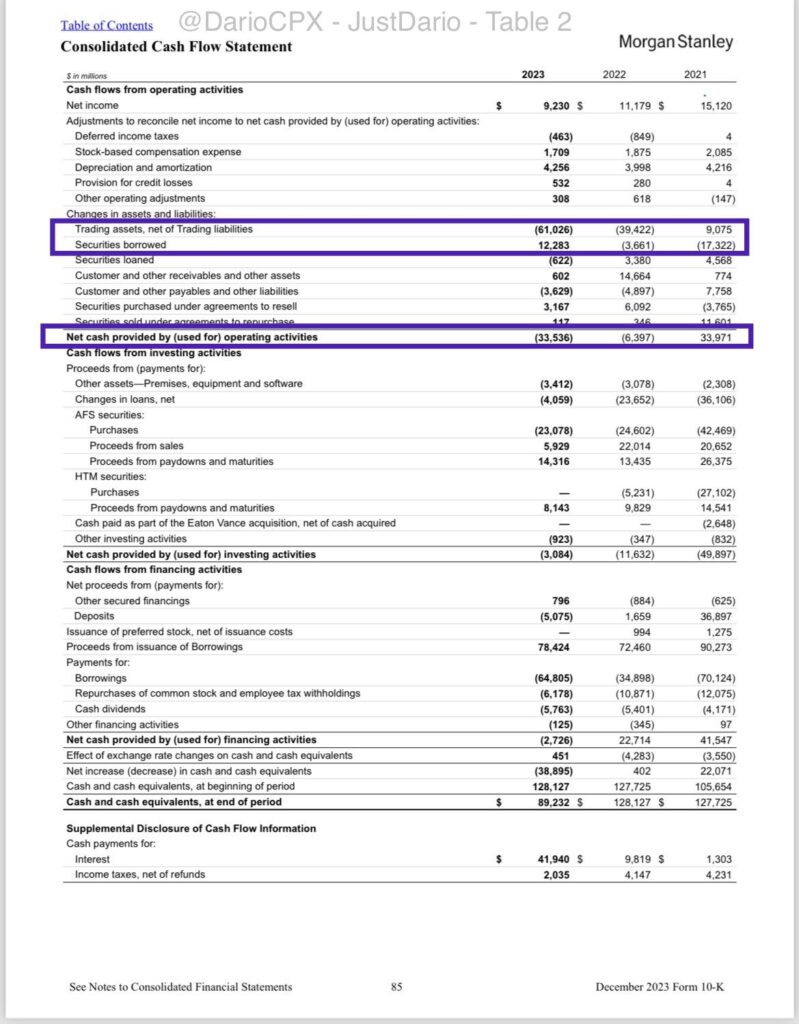
🚩 While I go through $MS assets I noticed another weird thing that goes against the latest trend among major financial institutions: $MS “Cash and Equivalents” dropped by 38.9bn$ YoY to 89.2bn$ while $MS total assets INCREASED 13bn$ YoY to 1,093bn$.
Ok then we must have a look at $MS Cash Flow statement to try to find a clue about what’s going on here

🚩 Please have a look at the highlighted parts in Table 2, do you notice anything strange? $MS “Trading Assets” (Net of liabilities) have been ballooning since 2021 while $MS turned from a net lender of securities in 2021 into a net borrower in 2023 for 12bn$ ⚠
🚩 What’s even weirder? THE INCREASE IN TRADING ASSETS PLEDGED AS COLLATERAL YOY EQUIVALENT TO ~38bn$ FROM $MS TO 3rd PARTIES IS THE SAME AS THE DECREASE IN CASH 💥

🚩 Alright, all of these elements give us a good sense of where the core of the problem is: $MS Derivatives books – Grab the 🍿
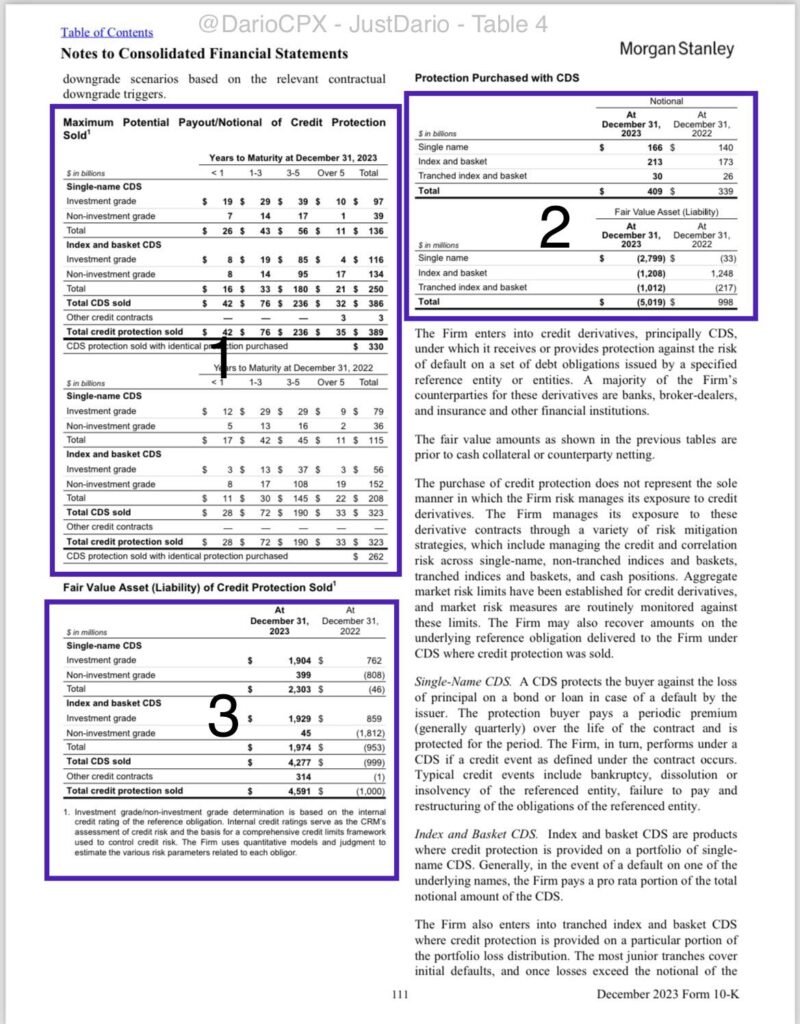
Please have a look at Table 4.1 now, the increase of collateral posted by $MS to 3rd parties is almost equivalent to the maximum loss $MS can incur this year for all the $CDS they sold! And these 42bn$ of troubles are not the whole story.

🚩 Like the infamous $JPM “London Whale” (That was selling more $CDS to cover the cash losses from the other $CDS turning toxic in $JPM CIO book), despite a banking crisis at the beginning of 2023 and a no-stop deterioration of risk for the whole year, $MS sold 66bn$ more in CDS through the year 😳
This is the other thing in this table I find incredibly odd. In theory, from 2022 to 2023, $MS bought more $CDS to hedge its books for 68bn$ equivalent right? How much would $MS have paid for it? In Table 4.2 we can see that comparing 2022 with 2023 that amount is ~6bn$ and the change in fair value to 5bn$ negative effectively turns these assets into a liability 🤨? Hold on, that’s bad right? So how would you compensate for that? Turning liabilities into assets of course! 🤣 As you can see in Table 4.3 $MS credit protection sold (a liability in theory) does now have a positive value that, of course, matches the one of the CDS purchased.
I conclude this post with a question, if $MS is so good at managing its $CDS exposure and overall risks why are they bleeding cash and their counterparts are running on them for collateral? Curious to know what you think 🙏🏻
