By now we know that US BLS data are totally unrealistic for anyone who lives in the real world. My goal in this article is to demonstrate how, after 2020, the BLS has been literally making up numbers that go against any law of statistics.
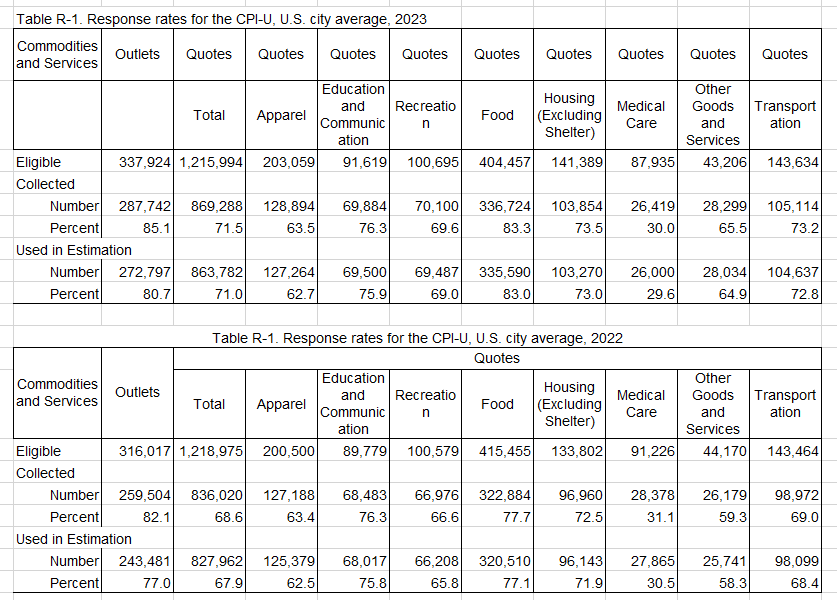
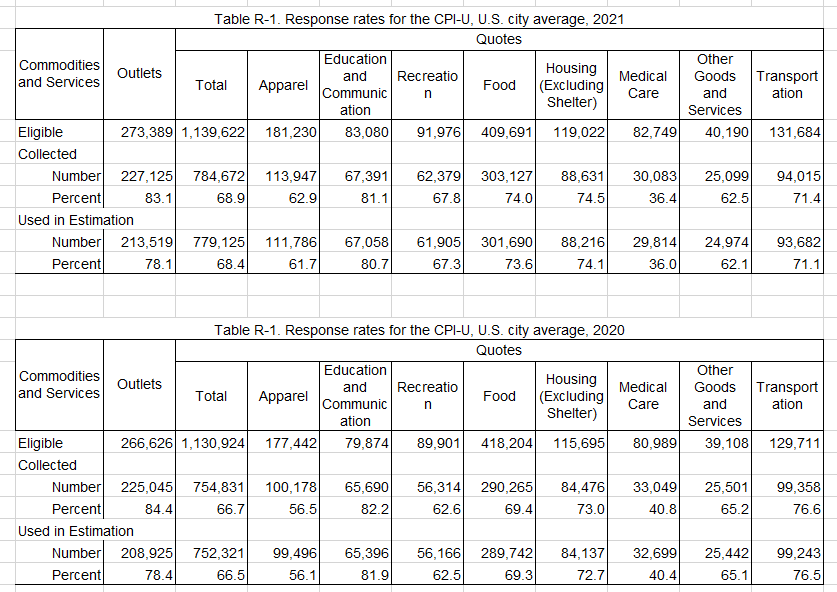
First of all, let’s start with the response rate to the BLS survey. As you can see from the tables below, provided by the BLS itself through the years, an average of ~20% of the participants do not provide answers to the questions submitted. That’s a pretty high number, isn’t it?


If you take a closer look at the tables, you will notice that for some categories the rate of non-responses is particularly high, like 60-70% for “Medical Care”. Why is this a problem? “Medical Care Services” expenses have a 6.5% weight in the total US CPI calculation.
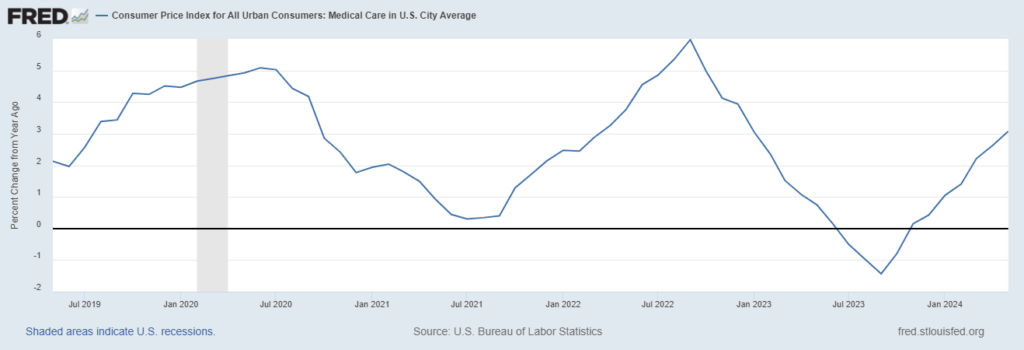
Now, according to the BLS, this is how the YoY growth for “Medical Care” in the US looks like… laughable isn’t it?

At this point, to understand the extent of the shenanigans ongoing here, the BLS every month reports the “Standard Error” for any measure in their statistics. What is the “Standard Error”? Here is the definition according to the BLS itself

Guess the standard error for “Medical Care Services” estimated by the BLS in their latest CPI release? 0.14%… wow! Considering that 60-70% of the people surveyed don’t answer the questions related to it, that’s a pretty low number, isn’t it? Of course, it’s too low to be true…
Here is where things become comical. From 2020 to 2023, with 60-70% of people not responding to “Medical Care Services” the average standard error the BLS claims on an annual basis is 0.29%… It does not take a master’s in statistics to understand this number is completely wrong.
This is where things start to become “funny”, to say the least. According to the BLS, their CPI measure is incredibly precise with an average yearly standard error of 0.10%. However, this clashes with the average of the categories within the survey that have a much higher standard error of 1.5% through the years, as you can see in the table below

Statistically speaking, these numbers do not make any sense, but what makes even less sense is that with ~20% of non-response rate on average, these errors are too low…
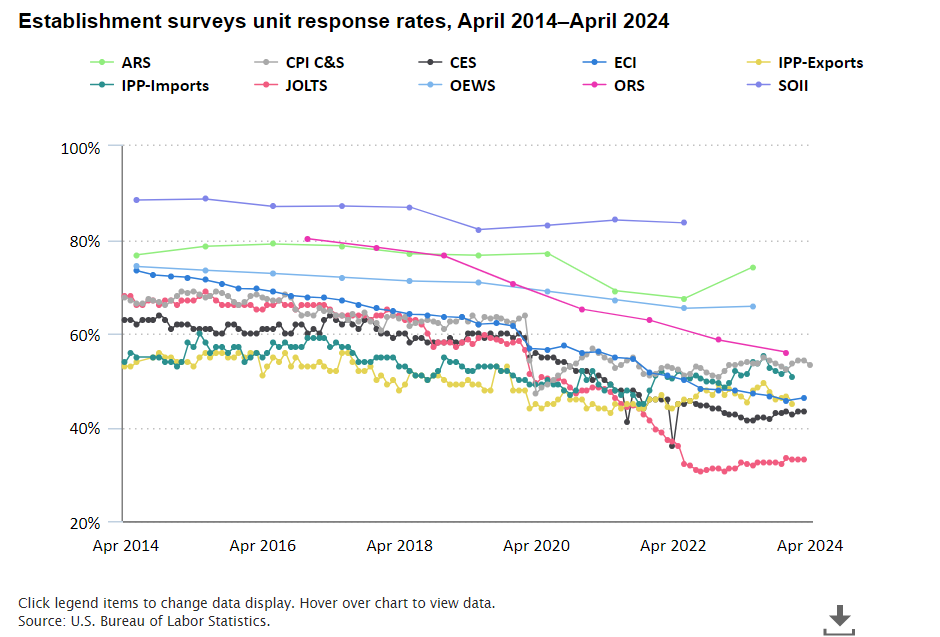
Furthermore, have a look at this chart directly from the BLS website here

Now tell me, how is it possible that BLS response rates are literally collapsing but somehow the “Standard Errors” in the official data remain the same through the years? Should we not see an increase in errors, logically speaking?
Here, the BLS explains how they collect the data if they don’t have them: “How We Collect Data When People Don’t Answer the Phone”
This paragraph is particularly telling of what’s going on: “At BLS, we consider data collection as much an art as a science. Sure, our staff needs to be well-versed in the information they are collecting. But they also need to be salespersons, able to convince busy people to spend a few minutes answering key questions. Part of that art is making a connection. There are old-fashioned ways that still work, such as sending a letter or showing up at the door. And there are more modern techniques, such as email and text. We are nothing if not persistent”
So let’s do some easy math here. The BLS has about ~2,000 employees and on average they (claim) to reach out to ~300,000 households each month. This means every single employee, including the leadership, is supposed to contact 150 households per month either directly (telephone or in-person) or indirectly (email or letter). Of course, this is physically impossible. Then what’s going on?
For anyone with a basic sense of how statistics works, it is clear that numbers are being totally made up out of thin air here, clearly for purposes that aren’t much aligned with BLS’s “mission” (for example political ones). To any person living in the real world, it is strikingly obvious how these statistics do not make any sense anymore, but yet critical central bank decisions and government ones are taken upon them. Do markets care? Of course not, since when “everything looks awesome” you would be stupid not to be bullish. However, there is a massive risk in manipulating data so much, that sooner or later people get tired of it and have to pay the consequences of misguided policies.
