A notification pops up on my phone about UBS’s latest earnings results and how cheerfully the market reacted, sending the stock up ~3% at the opening. As I always do, I go to the company’s investor relations website, download the latest report, and start reading. It didn’t take me long to get through the 74 pages of UBS’s report, and once I got to the end of it, I literally thought how not only were those numbers complete garbage, but how UBS accountants did such a great job cleaning up the statements to make it difficult to assess the real state of the bank’s books (post). Clearly, it didn’t take long for traders to figure out the same, and the stock price began tanking to lose 7% by the end of the day.
So, what did I see in the numbers to reach the conclusion above? I will start from the easy bit and then progress to the more difficult red flags to catch.
1 – Virtually zero interest income from the banking business
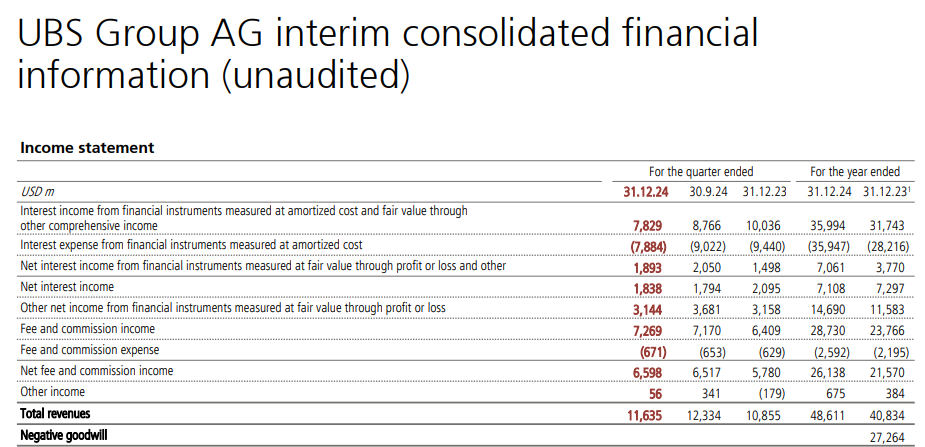
The first two rows in the table below refer to UBS’s business as a “bank,” meaning it acts as an intermediary that borrows money to then lend it to businesses in the economy. The bank made ~3.53bn USD net revenues from this activity in 2023 – not that good but, considering they were still digesting the CS toxic meal, not so bad either. What about 2024? UBS only made 47m USD out of 1.04 TRILLION USD of assets belonging to that revenue category, equivalent to a yearly return of 0.00451%.

2 – The Swiss Central Bank is actively supporting UBS to keep the value of its MTM assets inflated
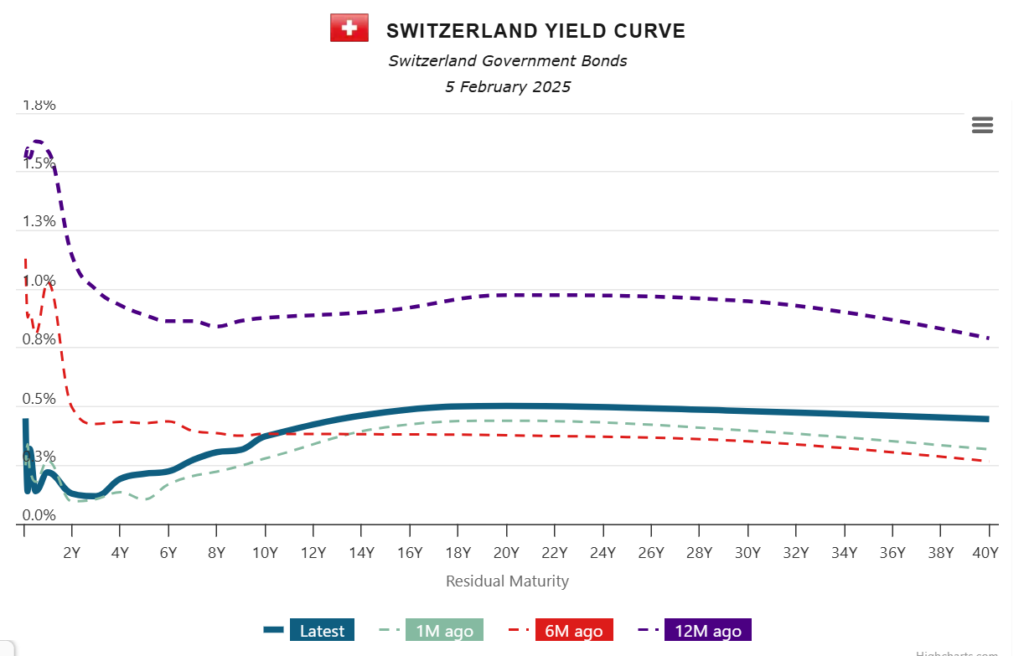
Among all central banks out there, the SNB has been the one with the most aggressive rate cut policy so far, many times surprising the markets with outsized rate cuts, paired with very dovish guidance. The combined effect is evident on the Swiss government bonds yield curve as you can see below (and it moved in a completely opposite direction compared to the rest of the market, including Japan).

Why so much effort on this front by the SNB? Clearly, they are helping UBS stay afloat since the bank managed to double the net interest income from assets measured at fair value from 3.77bn USD in 2023 to 7.06bn USD in 2024, and this helped to plug the hole in its banking business. The ultimate result is UBS recording an overall NII of 7.1bn$ in 2024, just marginally lower compared to 2023.
3 – UBS is bleeding cash
For the end of 2024, UBS reported 745.8bn USD of customer deposits and 53.9bn USD of short-term borrowings, a significant decrease from 791bn and 109.5bn at the end of 2023, for a total decrease of 100.8bn USD. How did UBS deal with this? UBS’s cash balances and deposits at central banks decreased from 314bn USD in 2023 to 223bn USD at the end of 2024, for a net of 91bn USD. Why is this a big red flag? Not only did UBS’s cash balances decrease by 29% in one year compared to a decrease in total assets of ~9%, but also ~90% of the outflow in deposits and short-term borrowings has been repaid with liquidity, meaning that the rest of UBS’s balance sheet is not as liquid and marketable as the bank pretends to portray. It should not come as a surprise that the liquidity coverage ratio decreased from 215.7% to 188.4% in one year, but as I am going to demonstrate to you next, this ratio is being greatly inflated since UBS assets aren’t as liquid as the bank says and they carry significant losses hidden in the HTM books.
4 – The hole in UBS books
As you can see in the table below, UBS’s total gross exposure, which includes off-balance items, is 1.85 trillion USD, and if we exclude cash and equivalents, it is more than double what is being reported. If the revenues from these assets are 36bn USD for the year, that is equivalent to a 1.95% yield, while rates for an equivalent basket of assets in the market right now are in the region of 5%. We can quickly calculate that the bank is currently carrying a Market loss of ~13.2% or equivalent to 244bn USD, assuming a conservative 5-year duration (hard to assess this figure since UBS discloses nothing in this regard). Beware here we are also avoiding adding the credit component on top, something that will make the figure worse, but there is no way to assess it properly even though the ~7bn USD of stage 3 impaired assets UBS reports is obviously too small considering what it inherited from Credit Suisse. From an RWA perspective, the loss figure is of course much lower, but as Credit Suisse’s experience should have taught everyone when it comes to liquidating assets in the market in case of distress, the value you can fetch is a far cry from the bogus metrics used for regulatory purposes that, let’s not forget, banks like UBS calculate based on their “internal models”. How much equity does UBS have in its balance sheet right now? ~85bn USD. At this point, it should not come as a surprise that the Swiss regulator is pushing UBS so hard to increase its own capital since only a fool wouldn’t figure out how this bank is at great risk of being insolvent and bailing out UBS will put the Swiss economy in great jeopardy since it is much smaller than UBS’s balance sheet.

Conclusion
At this point, it should not come as a surprise anymore that UBS shares lost 7% in the last trading session despite “beating expectations” and announcing a 3bn USD share buyback (clearly needed to maintain UBS’s share price inflated), and if the current trend remains, the bank is facing a significant risk of facing a liquidity crisis similar to the one Credit Suisse went through without surviving it.
JustDario on X | JustDario on Instagram | JustDario on YouTube
