Author: Vijay ( @sainik636 on Twitter/X)

Indian Elections are always a captivating spectacle. Given that it’s a multi-party democracy, predicting the WINNER & LOSER is a challenging game. However, there’s no shortage of psephologists, both professional & amateurs, who indulge in this exercise.
Since 1991, the Results have been linked to economic programs. As a result, stock market punters have shown greater interest than before.
Having participated in elections since 1977 – as an onlooker, a voter (1983), and subsequently as a market participant (1991) – I’ve had a ringside view of how markets behaved during the election period leading up to the formation of a new government.
Since 1991, two principal forces (Congress & BJP) have ruled for most of the time, except for a brief period of 2 years during the late 1990s.
While Congress was in power for 15 years, BJP has been slightly longer at 16 years, with the Third Front having a short stint of 2 years.
Let’s delve into market movements during each of the elections, beginning in 1991.
- 1991: The prospective PM candidate, Rajiv Gandhi, was assassinated during the first phase, and the Elections had to be postponed and held in two more phases. There was uncertainty all around, but the markets held steady and jumped just before the results day since they sensed a stable government would be formed. Congress was the single largest party with 244 seats, BJP was the runner-up with 120. This government lasted its full term of 5 years, and this period saw the birth of economic liberalization.

- 1996: While marketmen expected Congress to come back to power since the liberalization measures initiated by Manmohan Singh & Narasimha Rao had started yielding results, the markets indicated otherwise. Markets won yet once again. BJP was the single largest party with 161, while Congress was relegated to 2nd place with 140 while the Third Front had around 78 seats. It was a hung parliament & it was reflected in the market moves thereafter too.
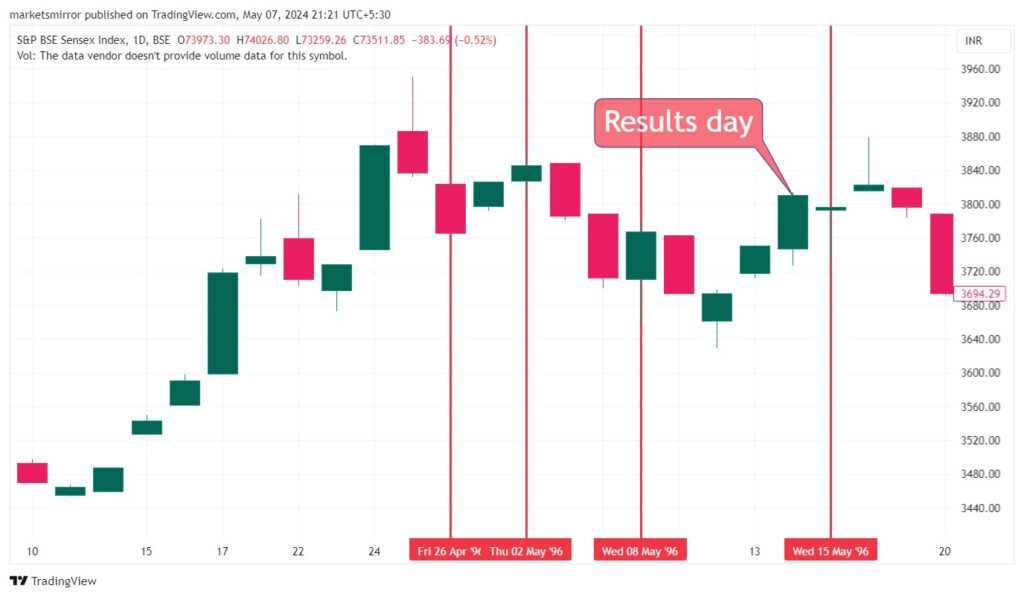
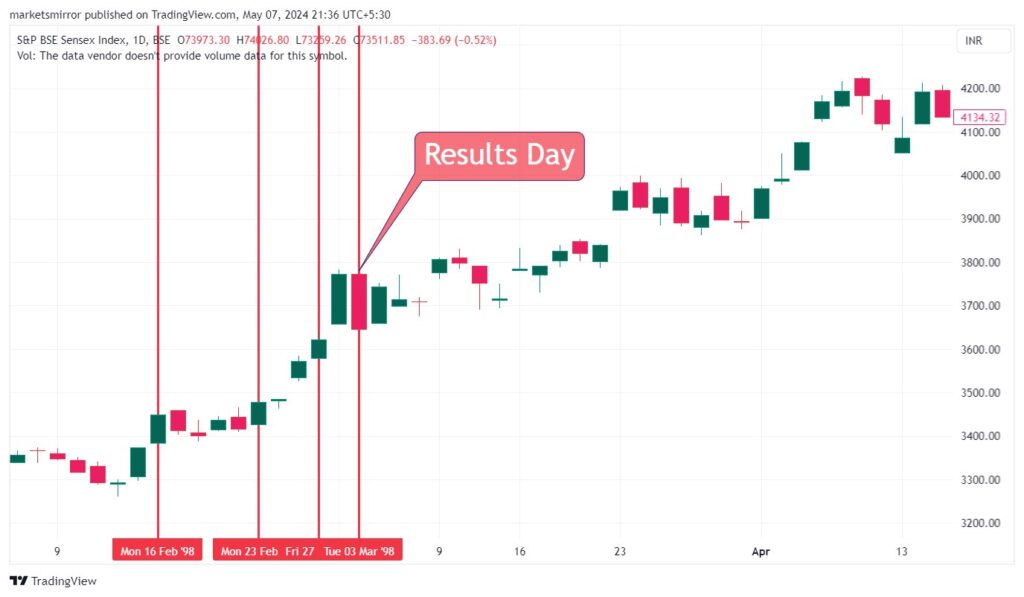
- 1998: While the marketmen were confused, the prices had started an uptrend, hoping that BJP would emerge as the single largest party by far, which is what happened. BJP improved upon its tally & reached 182 while Congress had to settle for 141. This government too would collapse within 13 months since there was no majority even with allies, but the market expected good governance under BJP hence the buoyancy.
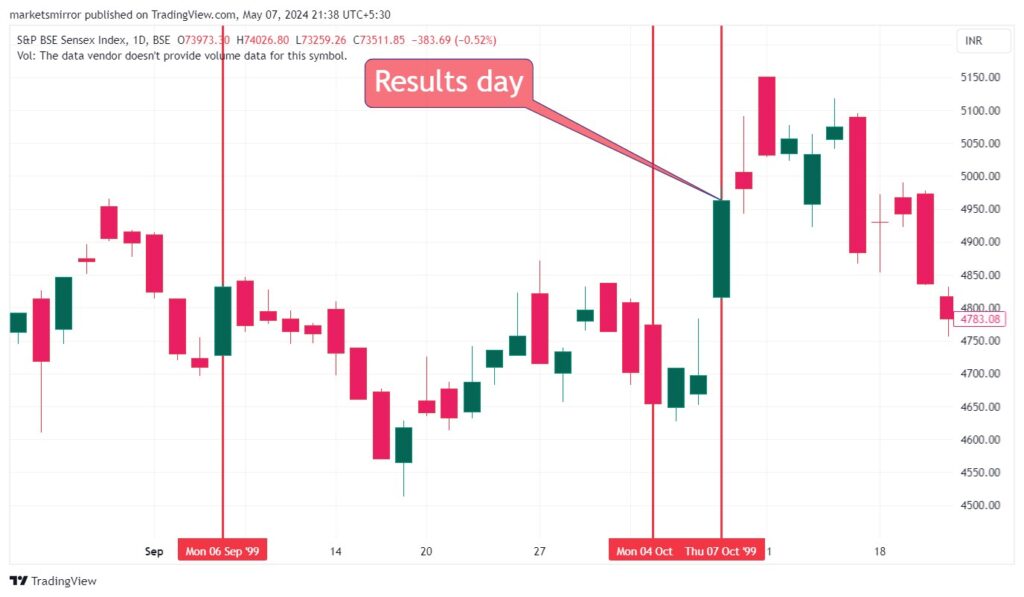
- 1999: Betrayed by its allies and reeling under US sanctions, the country went in for polls between September and October 1999. While the marketmen expected a HUNG PARLIAMENT yet again, the country chose the BJP, which, with the same number of seats but more allies, could form a stable government. Markets had sensed the possibility and had built up momentum before the government was formed & took off soon after.
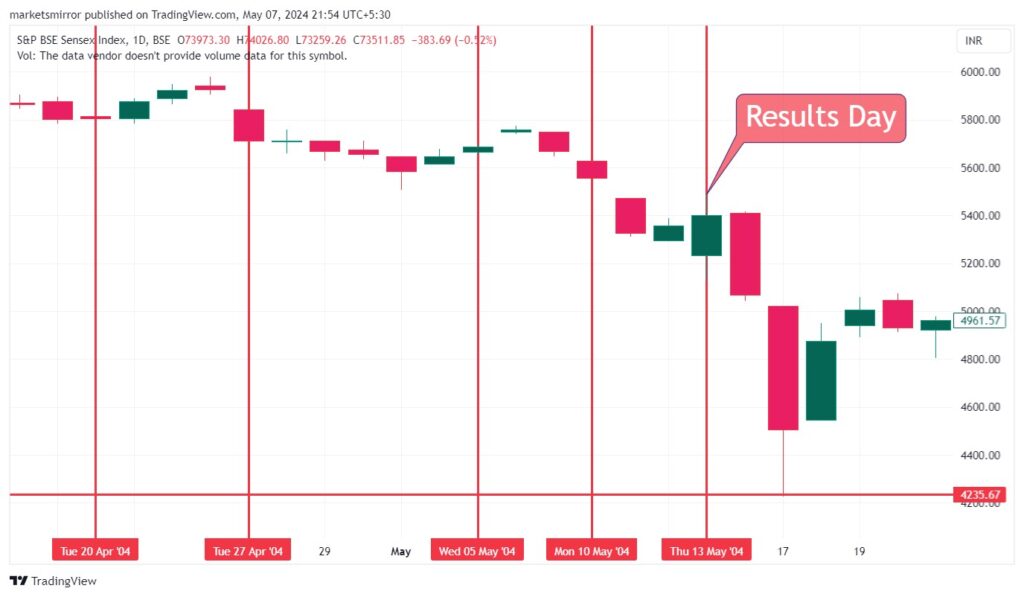
- 2004: This was a landmark election in more ways than one. The government was riding on the coattails of the INDIA SHINING Campaign, the opposition was disgraced and weak. The economy was doing well, the PM was universally popular, hence he advanced the elections by 6 months. Opinion polls were giving NDA around 340-350 seats & the punters (including me) had built up huge long positions in anticipation of bumper profits on the results day. However, the markets had a mind of their own. Since the first phase on April 20, the markets were beset with selling pressure & by the day of the results, they were falling steadily. It was a shock result. Congress was the winner albeit by a very small margin of just 7 seats while BJP got 138 seats. But the damage was done. The markets cracked hugely, by about 16% on a single day since everyone was overleveraged and had to sell in panic. But the market had spoken before the first round itself. None of us saw it coming.
- 2009: These elections were held soon after the Global Financial crisis & the economy was limping back to normalcy. The marketmen felt we would have a hung parliament just like in the 1990s since economic conditions were dismal. Yet the market was resilient going into the polls & when the results came on the weekend, it was an advantage of Congress with 216 seats while BJP was second at 116 seats. The markets leaped by 16% in a single day as bears ran for cover, yet once again marketmen missed the signals of the market.
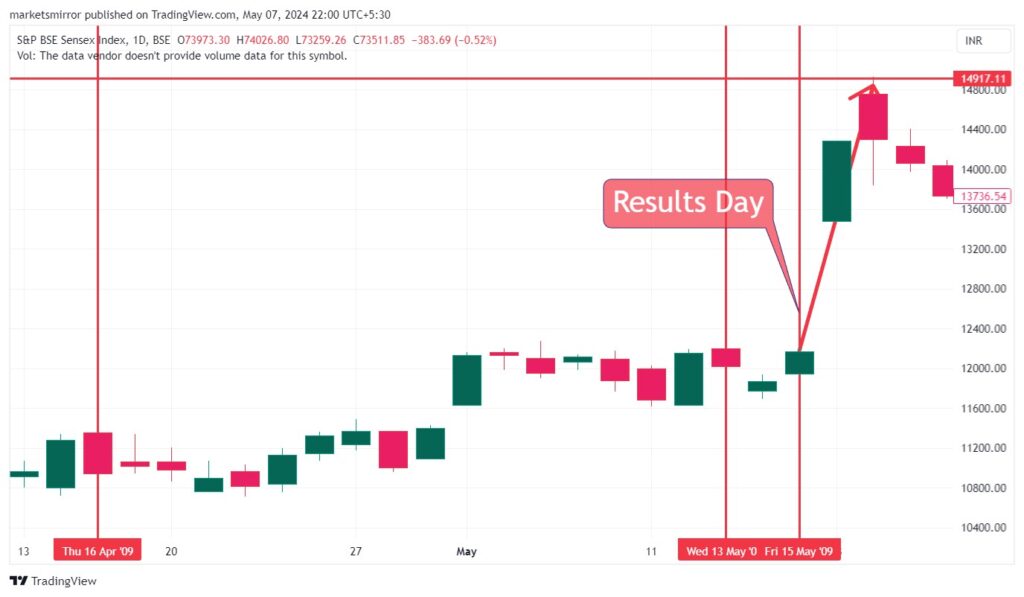
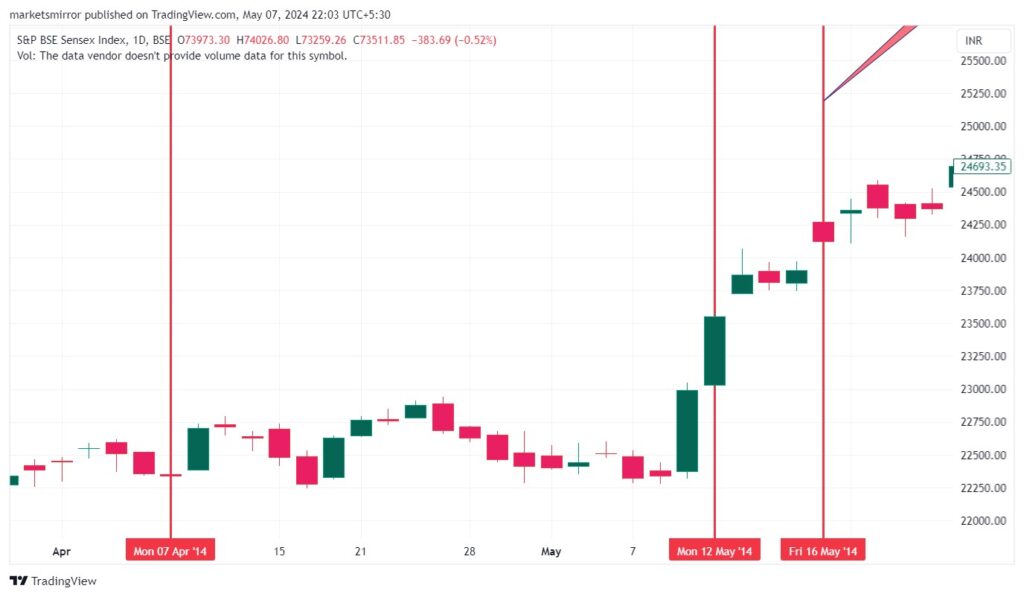
- 2014: While the challenger (Mr. Modi) was the market favourite, there were still doubts among the punters whether BJP would be able to pull off a majority on its own. Yet once again, the markets showed the way by being very steady leading to the various phases, then took off just before the final phase & then there was no looking back smashing many records in the process.
- 2019: The election campaign started off on a subdued note seemingly, with the challenger (Congress) having a chance, but the Balakot incident turned the tide in favour of BJP significantly. The momentum carried to 5 of the 7 phases. The market exhibited some nervous moments in the interim but recovered in the last phase to give a spectacular victory of 303 seats to BJP – the highest ever in 35 years.

- 2024: This time too, we have 7 phases. We complete the third phase on May 7th with 52% of the electorate having completed the exercise. The opinion polls are all unanimous that BJP alone is likely to get a minimum of 330 seats. Punters too are ALL IN with highly leveraged bets. No one is expecting anything less than the 303 seats which BJP got last time. Effectively, the punters don’t have a stop loss. It’s early days yet. We should have a clear picture by the end of the fourth phase ( 13th May) when nearly 75% of the electorate would have exercised their franchise.
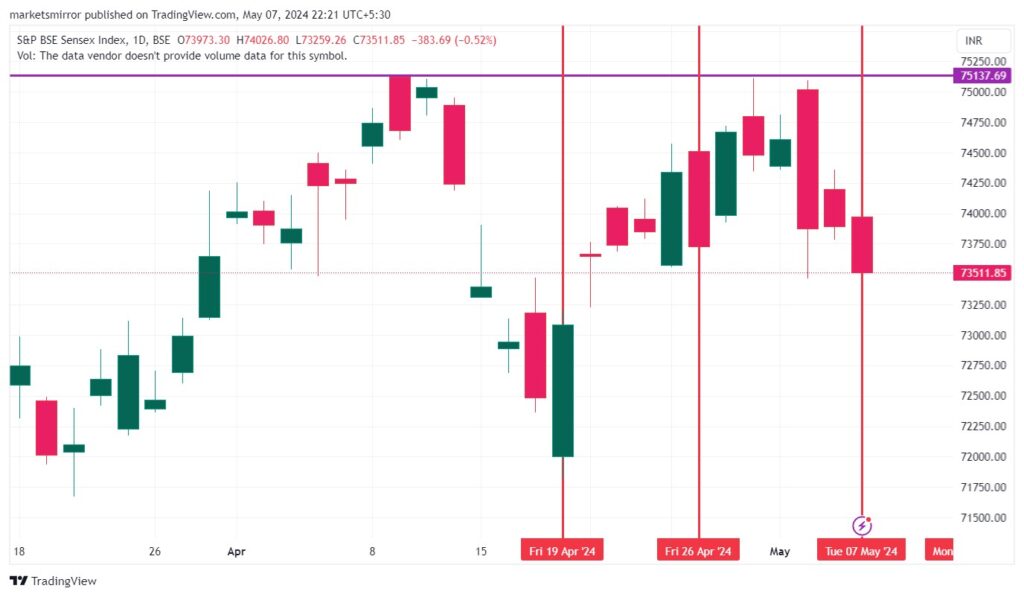
CONCLUSION: The market has got it right all the time since 1991 across 8 Elections. The price action suggests that the Market is dangerously poised for the Bulls due to heavy leverage & unwillingness to consider any other alternative except that BJP would get 350 + seats. The Market is telling us something else. Brace for Impact on June 4th.
