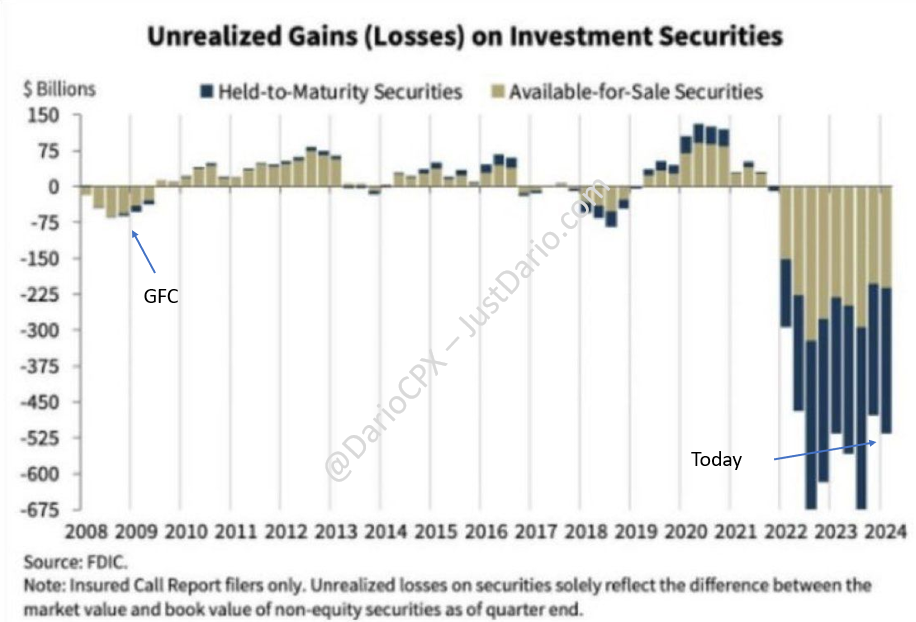
In September 2023, I addressed for the first time the (nasty) topic of #banks’ balance sheet health in the “This time is not different” post on X. After that, I expanded the analysis to large US and European banks in “WHICH BANKS ARE AT RISK OF GOING BUST IN A LIQUIDITY CRISIS BECAUSE ALREADY (RIDICULOUSLY) INSOLVENT?”. This showed how the situation, considering realistic mark-to-market values and not “La La Land” ones, was more worrisome than the one portrayed by banks’ management and regulators.
This week, the #FED just released its annual stress test exercise, or maybe we should call it a “don’t stress” test, of course promoting all banks with high marks (report). The results of this test were so ridiculous that a few hours later JP Morgan, not Dario, released this comment: “JPMorgan Chase says its stress test losses should be higher than what the Fed disclosed”
Now that we all agree the FED stress tests are as good as a report claiming the existence of unicorns, in the first part of this article, we will have a look at how things are in reality. In the second part, we will then perform meaningful stress tests on US and European banks’ balance sheets.
In order to understand the first part, it is important to refresh our memory on the methodology we are going to use, which is roughly going to be the same as in the first article several months ago.
This is what I wrote a few months ago: “During the Global Financial Crisis (GFC), banks got a little carried away, right? Looking at the Loans/Deposits ratio, a fundamental and powerful indicator to assess the health of a bank, both large and small US lenders collectively reached a ratio > 100% at the peak of the crisis. In simpler terms, in 2008, banks lent more than $1 for every $1 of deposit they received. Needless to say, this is bad news. Typically, a bank is considered solid when its L/D ratio is between 80-85% and, depending on the duration of loans (which banks rarely disclose to the public), this ratio can be pushed to 90% in certain cases. When the ratio goes above 90%, things get dicey, and when it surpasses 100%, the bank is in trouble.”
As highlighted in my first article on the matter, there is a significant difference between 2008 and today. Because of the change in capital requirements due to changes in regulations post-GFC, banks’ balance sheet structures changed. Across the board, every one of them shifted from a heavy concentration in loans to one in Hold To Maturity (”HTM”) and Available For Sale (”AFS”) Debt Securities. What’s the benefit of doing so? Not only are highly rated debt Securities like government bonds subject to a very low Risk Weighted Assets (”RWA”) ratio, usually ~20% but if included in HTM books the bank isn’t required to perform any mark-to-market on them (since the regulator assumes those assets will be held till maturity and the bank with a very high chance will collect all its principal). What about AFS books? Here, banks are required to report the “fair value” of those assets, in other terms, the value THEY think they will be able to sell them in the market. Needless to say, banks have no upside in making these assessments properly, and more often than not these “fair values” are close to the value the bank paid for the security (hence no requirement to report any loss).
The cases of Silicon Valley Bank, First Republic Bank, and Credit Suisse are the best examples of what happens when a bank is forced to liquidate assets that are accounted for at no loss in their books while the value is much lower in the market. This is why we will start having a look at the old-fashioned “Loan/Deposits” ratio, but then we will have to adapt it to today’s market conditions. Consequently, we will then expand it to the “(Loans+HTM)/Deposits” ratio first and then to the “(Loans+AFS+HTM)/Deposits” ratio. Essentially the goal here is to have a look at every 1$ of deposits and how much the bank deployed it in low liquidity assets (zero liquidity in the case of loans), effectively measuring the operational leverage carried in the books. However, since we do not want to be too harsh on them, in the end, we will calculate one more ratio that will include very Liquid Assets (”LA”) such as “Cash, Cash Equivalents & Net Repos” and “Net Trading Assets” (Net “HFT”) that (in theory) can be sold for the values reported in a bank balance sheet to fend off a potential bank run. If after reducing the total value of illiquid assets by the amount of liquid assets the ratio remains above 90%, it will be hard to argue the bank will face issues in case of a customers’ rush to withdraw their deposits right?
Alright, it’s now time to start diving in.
1 – Loans / Deposits Ratio

2 – (Loans + HTM) / Deposits Ratio

3 – (Loans + AFS + HTM) / Deposits Ratio

4 – (Loans + AFS + HTM – LA) / Deposits Ratio
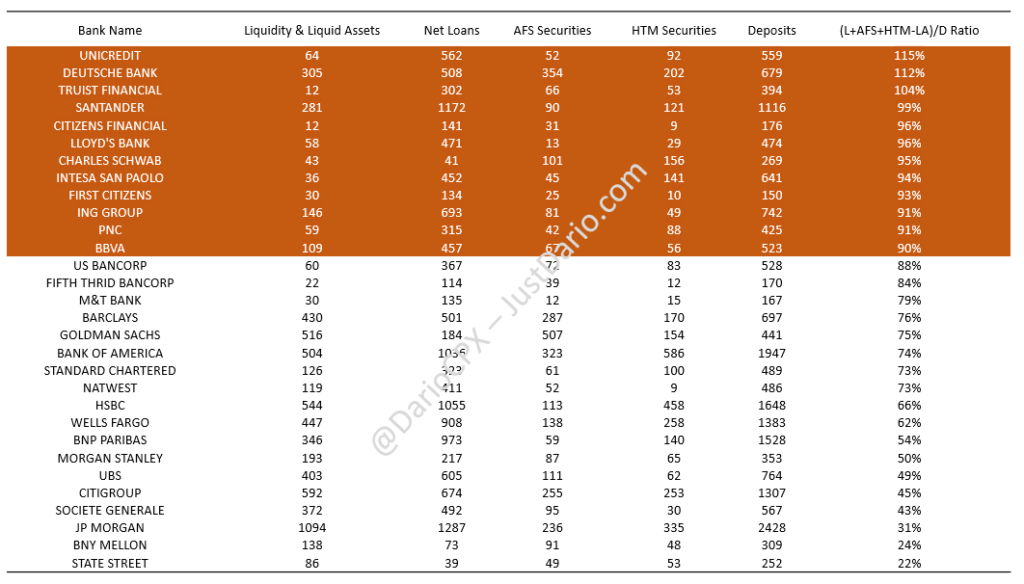
Yes, I know, there is a whole lot of red in all tables above. However, you may argue that Central Banks will step in if a serious liquidity crisis materializes. True, this is the theory and effectively that’s what they did till now because the issues at the very deep of the financial system surfaced during the GFC haven’t been truly addressed. There is a problem today though, Central Banks printed so much money out of thin air that we came to a point that they are now undermining the very existence of the fiat monetary system. Furthermore, as if this wasn’t enough, major banks across the globe are effectively operating with negative capital, and with governments running chronic and worsening deficits they have effectively no room to stretch their balance sheets further. Yes, people, there is a limit to the amount of money that can be printed out of thin air and the Bank Of Japan’s damages to Japan’s economy are the best example of what happens when that limit is crossed (WHY A HISTORICAL $JPY CURRENCY CRISIS IS AT THE DOORSTEP OF #JAPAN).
Now that we have a clear picture of how precarious the current banks’ situation is, let’s run some proper “stress tests”:
-
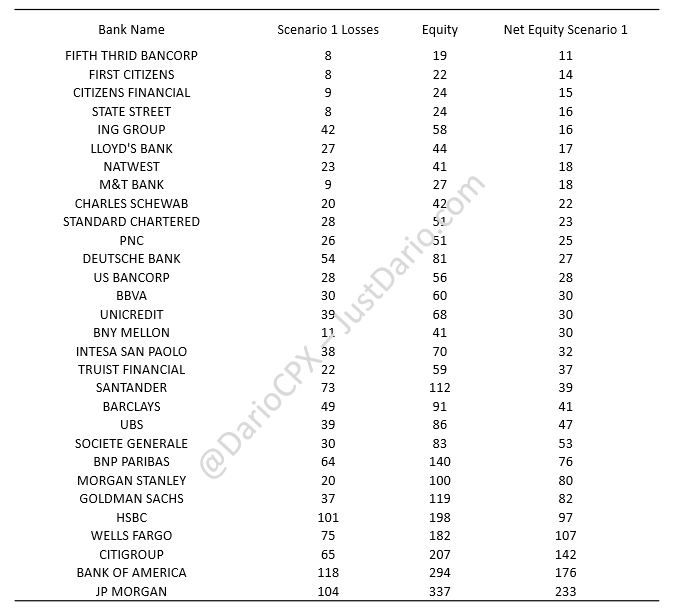
Scenario 1: the “Everything is awesome – No Landing” mark to markets
- 5% Loan Losses vs balance sheet values
- 2.5% AFS Losses vs balance sheet values
- 10% HTM Losses vs balance sheet values
-
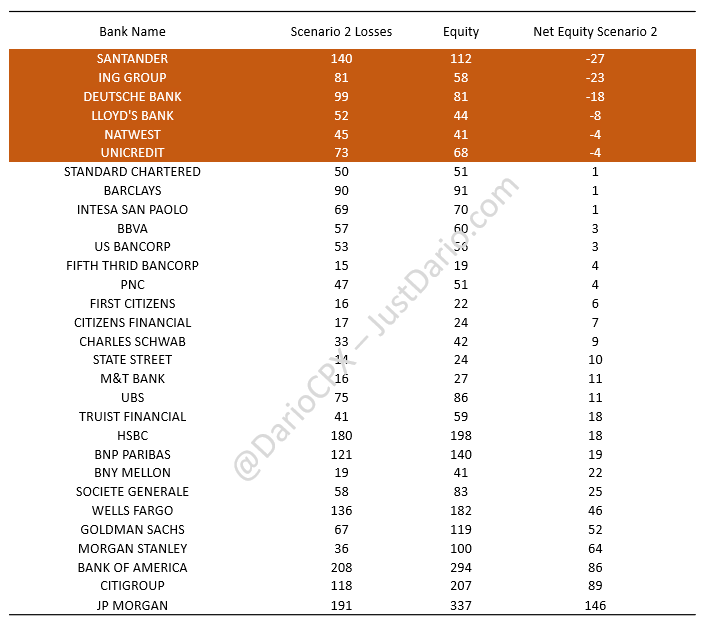
Scenario 2: the “La La Land – Soft Landing” mark to markets
- 10% Loan Losses vs balance sheet values
- 5% AFS Losses vs balance sheet values
- 15% HTM Losses vs balance sheet values
-
Scenario 3: the “Right Now – Hard Landing” mark to markets
- 15% Loan Losses vs balance sheet values
- 7.5% AFS Losses vs balance sheet values
- 20% HTM Losses vs balance sheet values
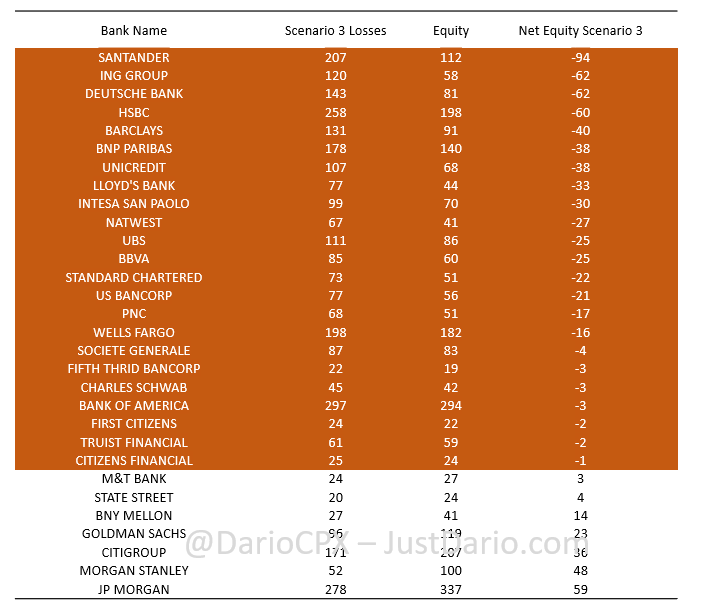
As a matter of fact, when troubles hit the fan, the unrealistic RWA and Capital metrics go to hell because the market does not care about how good you are in your own world, but in the real one. One example? A few days before going bust, Credit Suisse was showcasing “strong” capital according to regulatory requirements (“Credit Suisse taught us that, sometimes, regulations are not enough”).
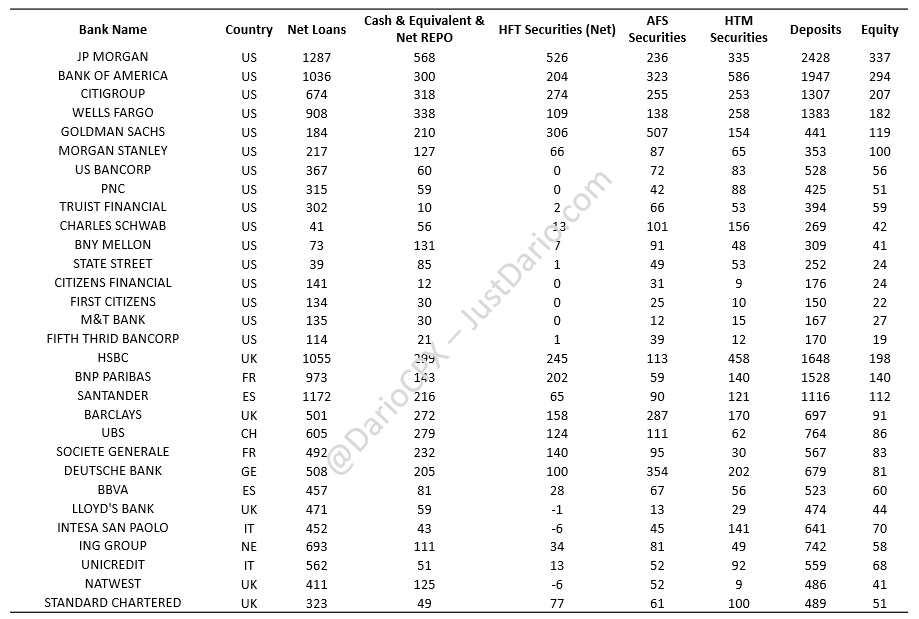
Here is the whole dataset I used for this article, numbers are in USD billions and I used a EUR/USD of 1.07 and a GBP/USD of 1.26 to convert the numbers for those banks not reporting directly in USD. For non-US banks, I reclassified their balance sheets according to US reporting standards for “Cash & Equivalent”, “Net Repo” balances, “HFT”, “AFS” and “HTM”. Feel free to run your calculations and come to your own conclusions if you do not like the ones I put forward.
Just bear in mind that, even according to official FDIC data, banks “paper losses” in banks’ books are right now almost SEVEN TIMES higher than during the peak of the GFC… and this is an “optimistic” assessment.
