
To be completely honest, when I saw what happened today in the first minutes of trading in the Japanese stock market, my jaw dropped to the floor. I could not believe my eyes, literally. The outcome of Japan’s elections has been quite bad, with the government in charge effectively now representing a minority in the country (Japan’s government in flux after election gives no party majority). However, as we have seen plenty of times in regions like Europe, those in power do not like to vacate their seats, especially when they have been in charge for less than 30 days like the current Japan’s PM Ishiba. What is he going to do now? Of course, he will try to expand his “coalition” to govern since the current one cannot. However, as we have seen over and over again, every time these types of wide coalitions are formed, everyone’s goal is to transition the country to the next general election with only ordinary administration laws passed through parliament. This does not bode very well for a country like Japan that needs deep structural economic reforms as soon as possible, but the stock market reacted positively to it.
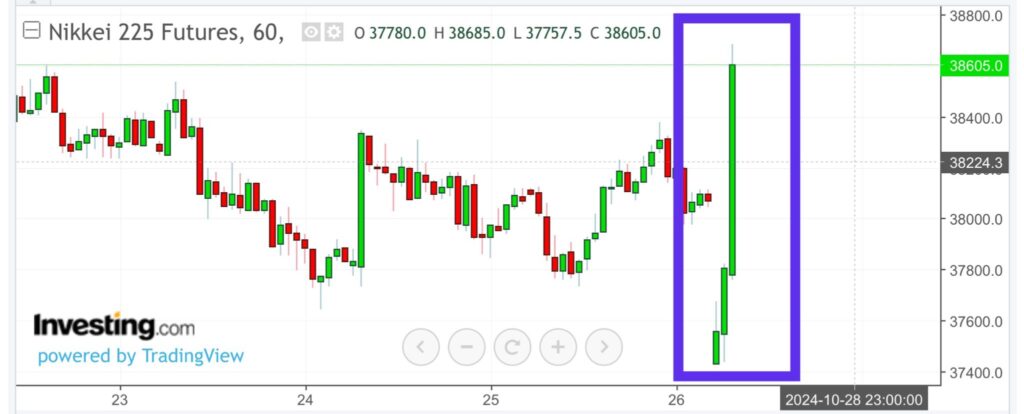
How can this be possible? MSM, of course, ends up coming up with pretty much a similar narrative all the time: “the current status quo” will remain for longer (they claim) and stocks love it since that would mean more money printing and deficit monetization. Of course, this is all garbage. What happened this morning in Japan was simply the repeat of the same script we had seen so many times already: those who rationally hedged for a bad outcome were squeezed out of their positions and had to quickly drop their protection to limit their losses. As a matter of fact, again, nothing happened in the market during the rest of the day, with all the action concentrated in the first few minutes. If you want to read more about this perverse dynamic, you can refer to this article I wrote 8 months ago: “WE HAVE NO ALTERNATIVE BUT TO RIDE STOCKS UNTIL THEY RUN”
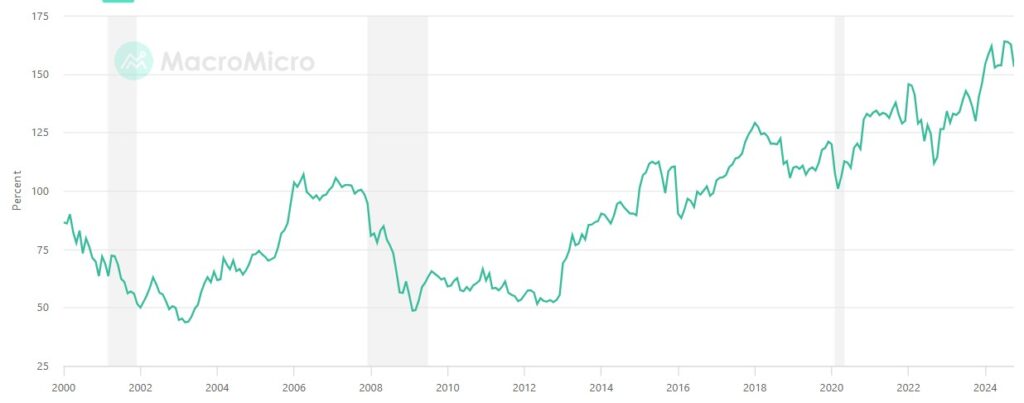
There is no better indicator than the “Warren Buffett” indicator (stock market capitalization vs country GDP) to measure how inflated a stock bubble is. Clearly, in Japan, the bubble keeps being inflated by the relentless BOJ money printing.
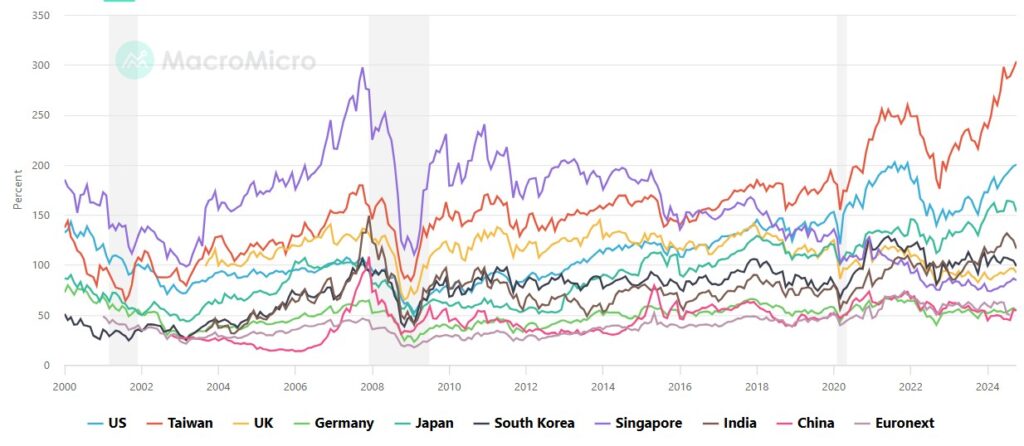
What about the other major countries? Here we have some surprises. First of all, the most inflated bubble is not the US as many believe, but Taiwan, thanks to the asinine valuation of TSMC that is one of the pillars, along with Microsoft and Nvidia, of the great revenues round-tripping scheme ongoing between the semiconductors and cloud computing sectors (archive). The US comes second with new all-time highs broken by the indicator on a daily basis now being generally ignored. Japan, a financially broken country, comes only in third place. Surprisingly, Germany, where the DAX and the economy are now on two completely divergent trends, does not have a very high Buffett indicator thanks to the bubble being concentrated only on the 30 largest stocks that still command a relatively limited proportion compared to all the listed ones that mainly do business within Germany’s borders. Not surprisingly, China comes last in a sign that the bubble in the country popped (and the government has no intention to re-inflate it again as we discussed before).
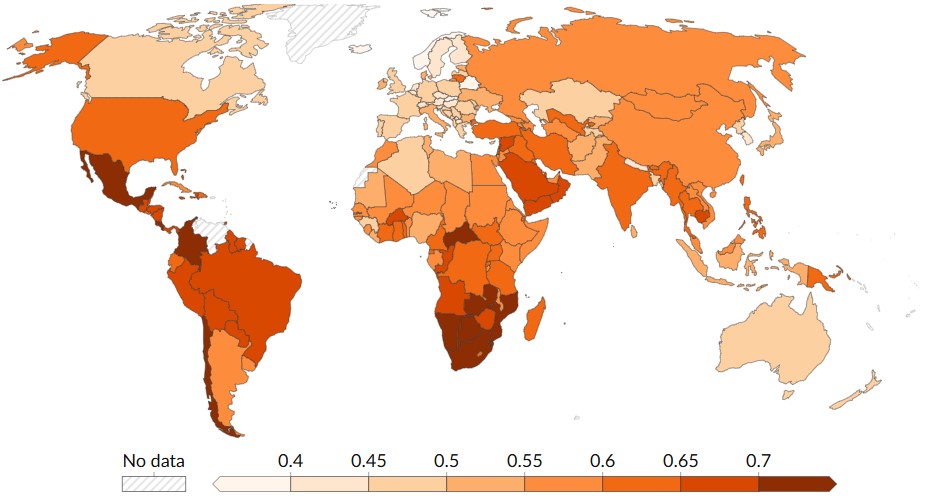
Who cares about the economy when stocks going higher every single day makes everything look awesome? Those who own little to no stocks are being crushed, as you can see in the wealth inequality map below
It has been a while since stocks do not care at all about “bad news,” but they are more than happy to run when any “good news” makes the headlines, even if these news items are becoming more and more rare and pretty much a broken record of a public narrative MSM are forced to follow if they do not want to lose money from their advertisers. Those who claim “this time is different” are yet again showing incredible ignorance of history that over and over again showed that every single time we come to these levels of distortion and inequality between stocks and reality, eventually the two will end up converging at a great loss for those who will still be invested in stocks when the rubber band snaps. It is impossible to time a market crash, in particular when the “magic money tree” keeps flourishing like it does today, but one indicator to pay close attention to is surely the yield curve that has been already screaming “Danger!” since more than a month now: THE US YIELD CURVE IS SCREAMING “DANGER!” AND ONCE AGAIN NOBODY IS LISTENING.
True, not all of the yield curve is inverted; there is one tiny bit of it still in negative territory but slowly grinding towards a positive spread: the 10-year – 3-month US Treasury yields.
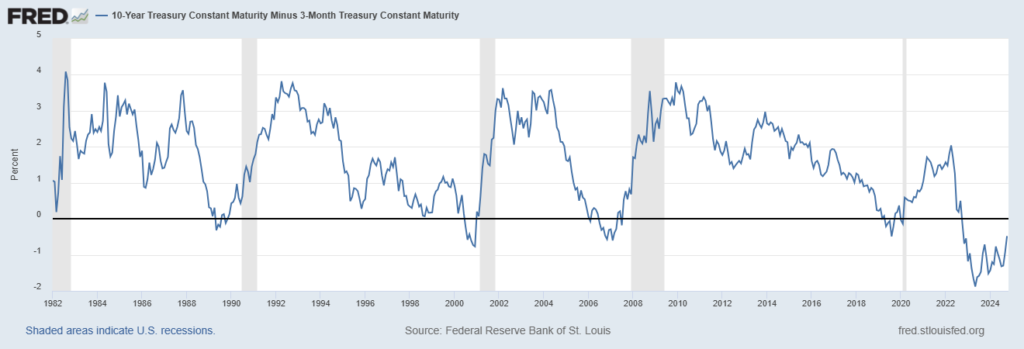
As you can see from the chart, this indicator has been a very reliable one to anticipate economic recessions, even the (they want us to believe) unexpected ones like the one triggered by COVID-19. Now, tell me one thing: what kind of economic downturn is reasonable to expect when this part of the curve has been now inverted for the longest time in history and reached a magnitude of inversion never seen before? Frankly speaking, those who still talk about “soft landing” are simply parroting a narrative that has nothing to do with what all the available data are showing; all they are holding onto are stocks that keep going up as if this can continue indefinitely. This is realistically impossible, and you better be prepared rather than relying on the MSM to warn you about it, but hey! Till “everything is awesome,” no one has the intention to spoil the party because it’s so fun, so why not enjoy it till the last bit even if there might not be a lifeboat for everyone when the music stops and the global economy Titanic inevitably sinks.
JustDario on X | JustDario on Instagram | JustDario on YouTube
