#GS Q4-23 was quite a spectacular game of smoke and mirrors that, of course, fooled the mainstream media.
CNBC – “Goldman Sachs tops revenue estimates on better-than-expected asset management results”
WSJ – “Goldman Scores a Win With Sharply Higher Earnings”
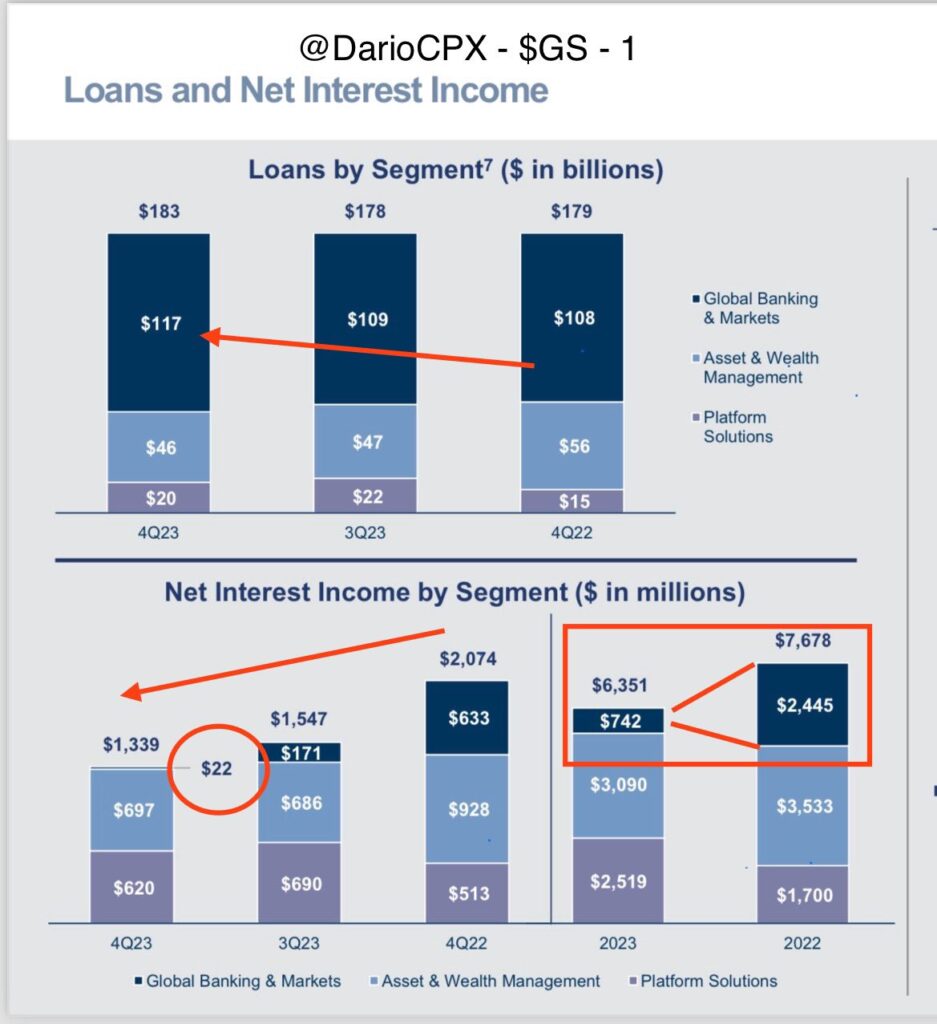
Let me show you one of the “tricks” they used. Please have a look at Picture 1 from the #GS presentation. The stacked bars representing the trend in NII are positioned in a way that goes upwards from left to right, triggering the brain to associate that with a “positive trend”, while in reality, #GS Net Interest Income crashed from 2bn$ in Q4-22 to 1.3bn$ in Q4-23!

What was the bank trying to “hide” here? Perhaps a number that surely would not have been good for #bullish headlines, but rather the opposite. #GS NII in its investment banking division (aka Global Banking & Markets) for the whole of Q4-23 was only 22m$!
Wait a second, wasn’t the #GS Investment Bank loan book the largest in the bank at 117bn$? Furthermore didn’t the loan book growth from 109bn$ in Q3? Uh oh, smells bad… It smells worse if you consider that for the entire year the NII of this book crashed 70% from 2.445bn$ in 2022 to 742m$ in 2023m.
It’s fair to wonder if #GS is having some issues with financing their investment bank loans book and as a result, their funding costs keep increasing to the point where they now outpace the revenues. Furthermore, everyone knows that when a bank cannot make money “being a bank” that’s a big red flag right? Let’s have a look at their “cash and equivalents” to see if things are fine there.
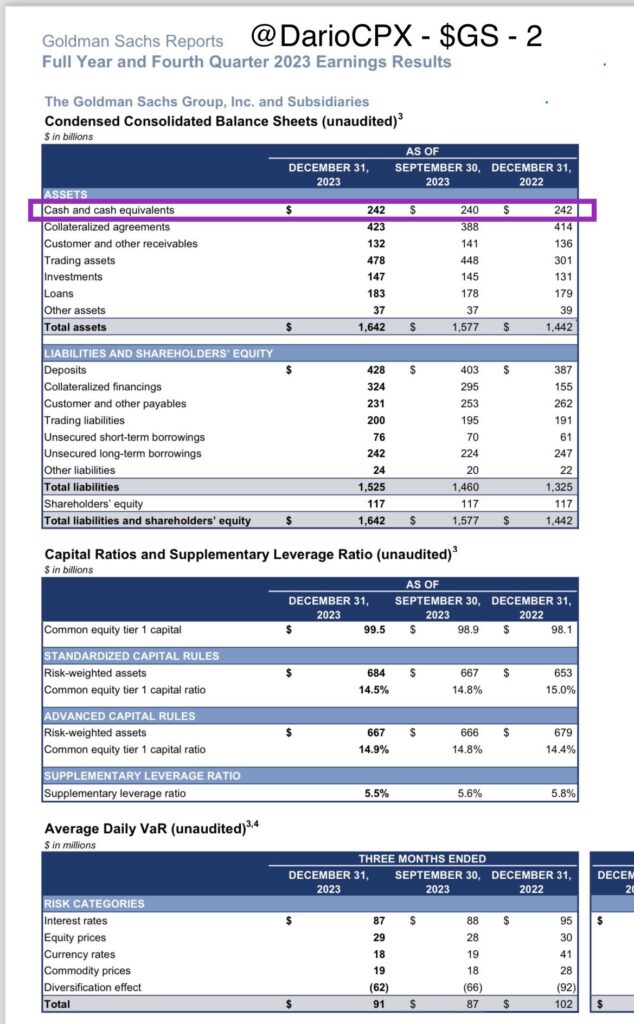
Isn’t it weird that the #GS “cash and equivalent” balance for Q4-22 and Q4-23 is exactly the same. It’s even weirder that this balance only increased by 2bn$ from Q3-23 to Q4-23 (Picture 2). Wasn’t #GS invited to the “Window dressing party”, did it cost them too much to raise cash, did they run out of good collateral to raise more cash, or a combination of these 3 options? Let’s have a look at the #GS peers comparing Q3 and Q4 balances to see if this happened elsewhere:
- #JPM 861bn$ > 900bn$
- #BAC 351bn$ > 333bn$
- #C 254bn$ > 261bn$
- #WFC 288bn$ > 317bn$
- #MS Not Disclosed

So it looks like #GS wasn’t the only one not invited to the window dressing party, but #BAC too. Well… that #BAC numbers for Q4 were questionable is something we already addressed (post in quote below). What’s surely concerning here is that, in comparison with Q4-22, #GS is the only bank that so far didn’t significantly boost their “cash and equivalent” balances. Because #GS is so good at managing risk that they don’t need it or (scarily) because they couldn’t do it like to others?
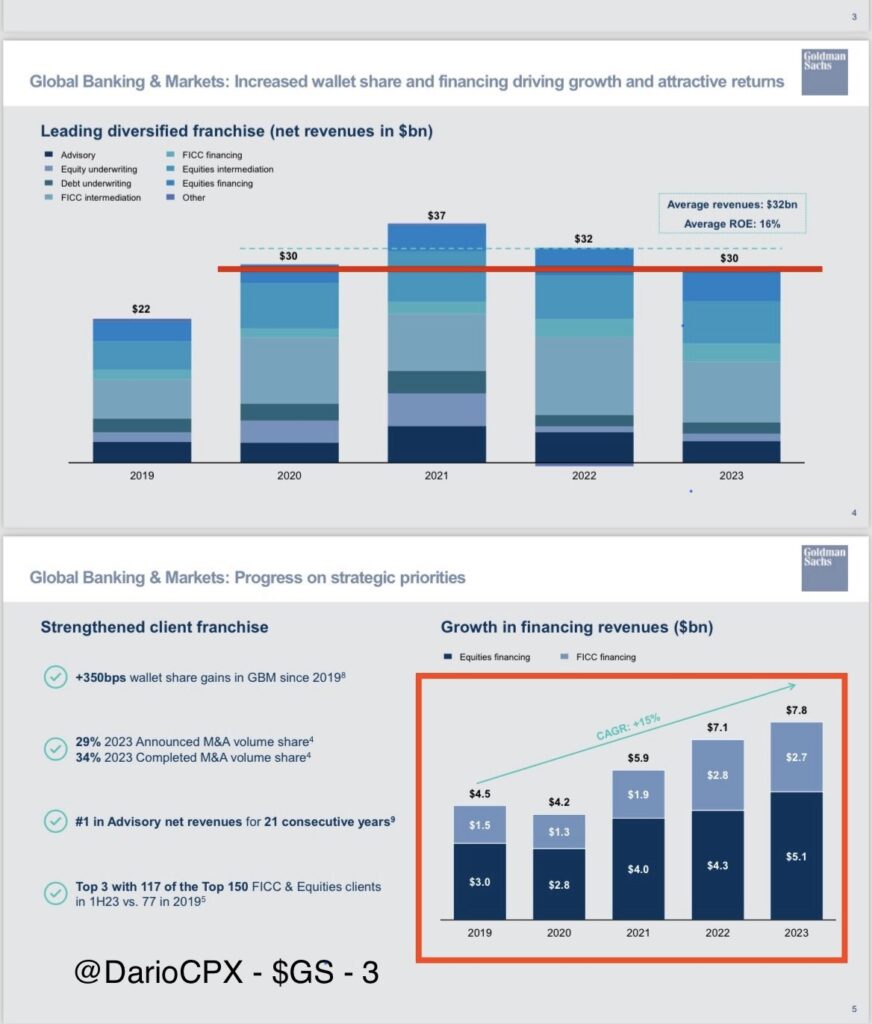
Another thing that #GS “bragged” about in its Q4 was the steady increase of its Equities and FICC financing revenues that, as you can see in Picture 3 (please also note how, this time, the bars in the presentation are stacked “correctly” in the right direction), is quite on a different trend compared to the bank revenues overall (#GS net revenues are back at 2020 levels). Personally speaking, I am not sure it’s a very wise move to make money providing leverage to Hedge funds and Private Equity in a market that is already running at nosebleed leverage levels. Furthermore, it looks like they do that more for “fee revenues” rather than NII ones (as we discussed above).

Clearly, after dodging the Archegos bullet 2 years back (#CS took it), #GS is back at playing Russian roulette with other brokers considering lending to Hedge Funds and Asset Managers is so far the biggest risk item across all balance sheets reported (TwitterX).
Unfortunately, #GS disclosed very little in its Q4-23 financial statements release and while I noticed other “stranger things” in their number I will need to wait for their SEC 10-Q filing to clarify what’s going on there.
Read on TwitterX.
