Thank you for waiting, but I assure you what follows isn’t going to disappoint you!
Two months ago in “This time is NOT different – Part 2,” I flagged how my analysis at that time flashed (big) red warnings on several US banks (TwitterX).
My analysis today will expand on the methodology presented (TwitterX) to include the following points:
- I will now include the largest European banks. Consequently, I reclassified their figures to harmonize all the datasets on US reporting. In particular, with regards to Available For Sale (AFS) and Hold To Maturity (HTM) securities.
- All values presented are in $USD. Non-USD figures have been converted using the 30th September FX rate for consistency.
- Shareholders’ Equity is considered in its entirety.
Now that the stage is set, the show can begin!
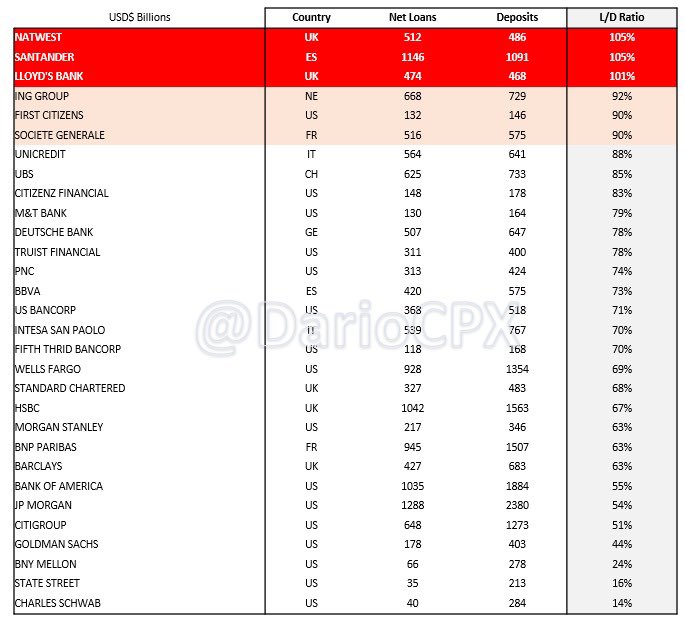
LOAN / DEPOSIT RATIO
A L/D ratio above 90% is already a warning sign, but there are 2 banks that managed to lend more than the deposits they collected! (Table 1)

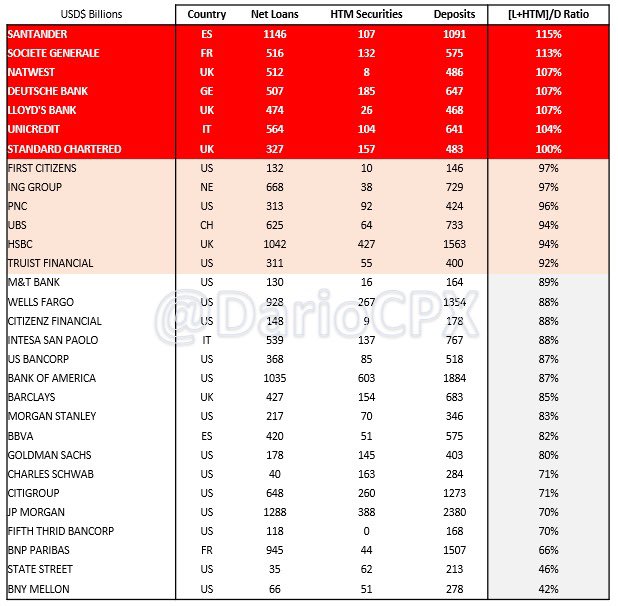
[LOAN + HTM] / DEPOSIT RATIO
HTM books are now officially “Hide to maturity” and stuffed with assets trading at a significant loss because of high interest rates (and soon high credit losses too). Not only banks cannot afford to sell those securities, but trading at such a discount to the par value, they even stop being collateral-worthy. Effectively, the risk of those books is now equivalent to the loan ones. Furthermore, bear in mind there is no #BTFP in Europe, while in the US, that only applies to US Treasuries or government-guaranteed securities.
Now, check how many banks hold more highly illiquid assets than the deposits they collected…(table 2) I feel now the warning bells in your head are already pretty loud.

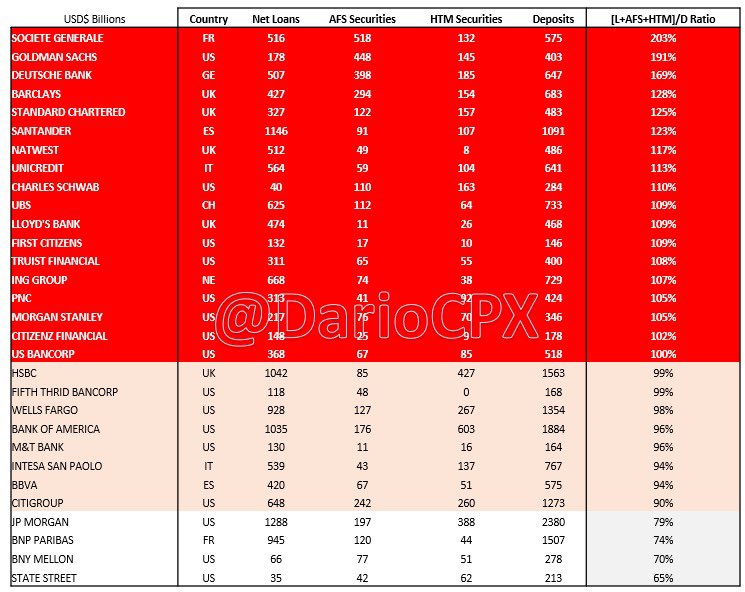
[LOAN + HTM + AFS] / DEPOSIT RATIO
AFS securities aren’t Marked to Market but booked according to their “fair value.” Translated, their real value in the market is lower due to a lack of liquidity.
Now, check how many banks cannot cover their deposits if we include the AFS assets in the analysis… (table 3) I bet now those bells in your head turned into a Marilyn Manson concert!

At this point, I hope you agree with me that all those capital ratios and risk metrics the regulators use to assess banks’ health are completely useless. As a matter of fact, banks that went bust always had “strong capital” according to the regulatory metrics, from #CreditSuisse (recently) to #Lehman in 2008. Fyi, both banks imploded with an “A” rating!
Alright, now is time for fireworks!
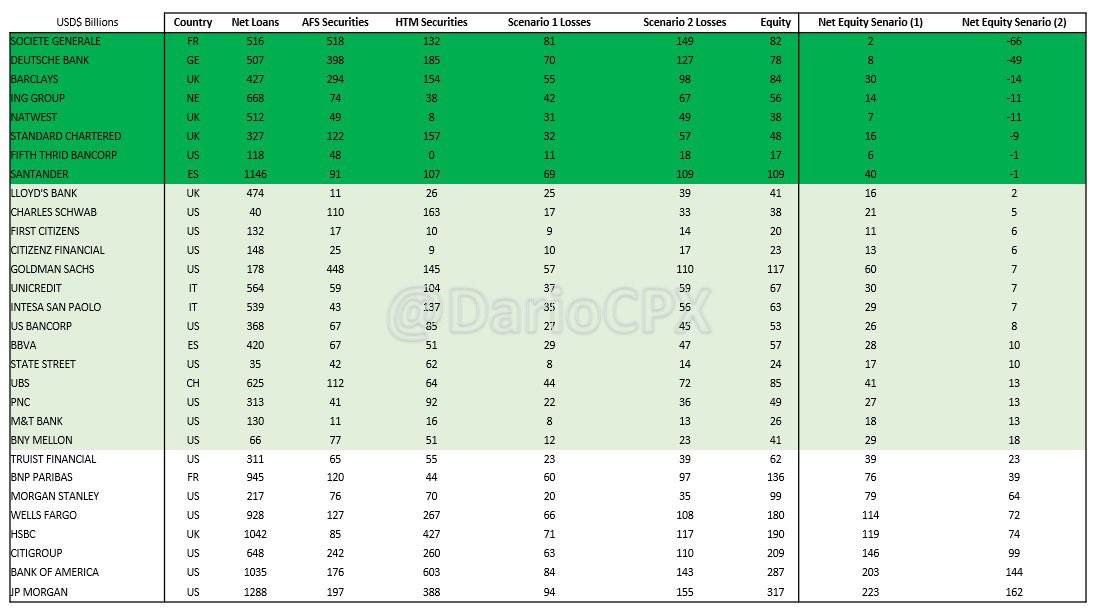
In the last table, I present two scenarios on the current state of banks’ books:
- “La La Land” that only assumes 5% losses on loans, 10% on HTM, and 2.5% on AFS books and compares those with the bank’s total equity.
- “Soft Landing” that assumes 7.5% losses on loans, 20% on HTM, and 5% on AFS books.

I wanted to include a “Realistic” one, but my heart ❤️ couldn’t bear it, sorry. Feel free to play with the data and see what happens if you assumes realistic losses..
Considering how twisted the reality we are living in is, I used green crayons to mark all those banks that have high chance of being already insolvent in the “ridiculous” scenarios presented.
Important to bear in mind is this analysis only considers on-balance sheet items to limit its complexity. However, if we bring in off-balance sheet items I strongly doubt banks like $BAC , $UBS and $HSBC will come up so strong as per previous detailed analysis I posted…
Beware, during a financial crisis, all the assets, including “cash and equivalents,” suffer a haircut while liabilities only get a haircut after a company files for Chapter 11. This means that the chances for the assets I left out to be able to increase in value during a crash to compensate for the calculated losses are close to zero.
